
- Home >
- articles >
- maintenance-management >
- whats true downtime cost
What is the "True Downtime Cost" (TDC)?
By Don Fitchett
The key to realizing more significant savings from more informed management decisions is predetermining the "True" cost of downtime for each profit center category. TDC is a methodology of analyzing all cost factors associated with downtime and using this information for cost justification and day-to-day management decisions. This data is likely already being collected in your facility and needs to be consolidated and organized according to the TDC guidelines.
_ = 0 to 30 Employees
_ = 31 to 50 Employees
_ = 51 to 100 Employees
_ = 101 to 200 Employees
_ = 201 to 301 Employees
It is common for management decisions related to equipment downtime to be based primarily on labor costs. Of course, production demand is also at the top of the priority list. The bottlenecks are considered in the decisions if known. Some facilities overlook equipment like air compressors, boilers, and strappers as a bottleneck out in the warehouse. The decision-making balance to maintain is between production demand and "True Downtime Cost"® (TDC). Unlike the standard approach, production demand and direct labor cost are the primary parts.
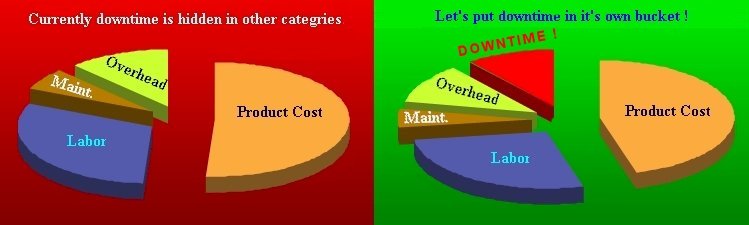
Using a TDC methodology, the 'Overhead' bucket becomes very small, making clear all the areas of most significant opportunity. In these times of economic turmoil, looking at the "True Downtime Cost"™ in its respective categories is critical to see the most crucial opportunity and profit from the valuable insight this methodology will bring. You will learn that many metrics with cost savings and bottom-line improvement opportunities far outweigh the labor category and the immediate temporary gains of downsizing.
Hidden cost
Below is an example of the hidden cost made relevant in just one of the proposed TDC buckets: labor. You will see that the true cost of labor associated with the downtime scenario is only $295. That amount pales compared to the other TDC categories combined, which can be 10 to 100 times that amount depending on the particular downtime occurrence. You can see how the TDC method can be a valuable cost justification and benchmark tool for maintenance managers. It is an excellent analysis asset to executive management and a great sales tool for those who provide services and products to manufacturers. (Especially ERP and CMMS vendors who are the consolidators of the data)
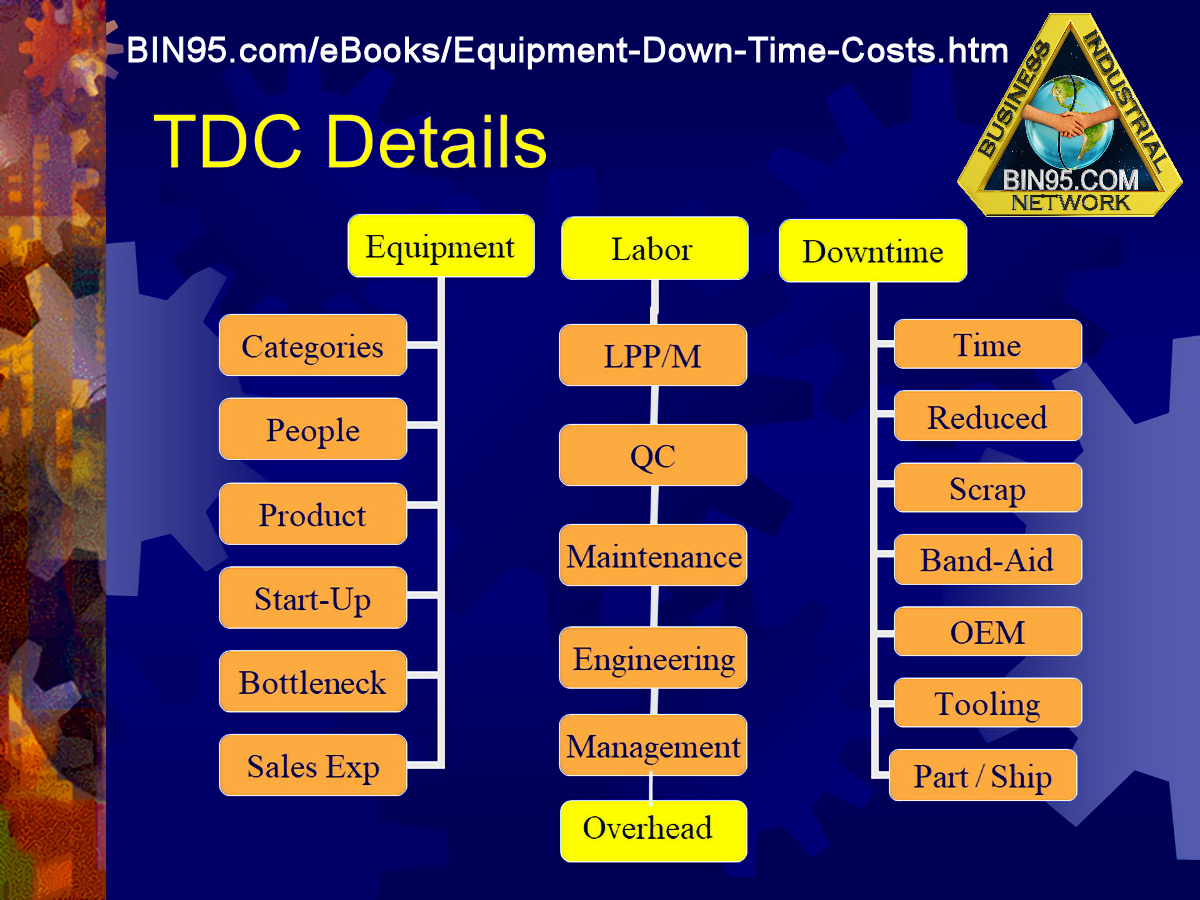
There are three main downtime categories proposed. The main categories of "Equipment Cost" and "Labor Cost" are metrics that are the one-time entry of constants, updated annually, and exported from your existing computer systems. The main "Downtime Cost" category contains the metrics that are "per downtime" occurrence entries, most exported from your existing CMMS. The data is recorded from facility to facility and from software package to software package and varies greatly. I have a detailed analysis of each downtime cost metric, but the results are too great to mention in this article. Surprisingly, some metrics have significant cost savings opportunities yet are overlooked by the general industry.
Since labor cost is one of the most popular areas to seek opportunities, let us look at just one method of old-school thinking. (Which also happens to be a primary concern in downtime decision-making.) Labor, more specifically, direct labor. For example, six operators do not-so-productive cleaning while a machine is down, and two maintenance technicians repair it. The decision-makers are thinking...
'At $10 per hour operator wage, $20 per hour maintenance wage, that is $100 per hour. I know overhead is involved, too, but with so many categories, it is too complicated to consider. Overhead is just a percentage of my man-hours anyway.'
Now, compare this to the true cost in just one TDC category: labor cost. First, with the overhead bucket gone, the employees' hourly cost is the actual cost to the company, with insurance, retirement, training, admin, etc. Double the hourly wage ($200) is a safe figure. As long as you are not dealing with a bottleneck, we need only consider the indirect labor factor. In our example, there was a QC inspection at startup. The most apparent employees are:
- The tool setup person.
- The line supervisor.
- The maintenance supervisor.
- The plant manager.
- The parts procurer.
We can calculate the indirect labor cost with more detail in the scenario. The inspector took 15 minutes for the QC inspection ($5), the setup person also took 15 minutes ($5), and the event took the supervisor from his regular duties for the entire hour ($30). The supervisor had extra logistics, reassigning employees, rescheduling, etc. For the sake of argument, the production demand was high. The high demand required two more high-dollar employees, typically hidden in the overhead. The maintenance manager coordinated ($30), and the plant manager was on the scene for 15 minutes to set the priorities and get the facts firsthand ($25).
The total TDC for labor is $200 for direct labor + $95 for indirect labor for $295. We all know that most would not bat an eye at $295 in the industry. There are two points to be made by this example. One is the commonly overlooked "overhead" cost, hiding almost 66% of the true cost in the labor category alone. The other point known to upper management and accountants is indirect labor, a large part of the picture yet only considered daily by very few.
The above was a best-case scenario. Consider a bottleneck with 20 downstream employees affected. Add in Engineering, material handlers, more management/supervisors, controller, safety personnel, accounting, secretaries, rework, and offsite QC inspections. You could include the offsite personnel costs like consultants, OEM techs, etc., but having those costs in their own category is recommended as they are so great. Think about if the entire plant was down. How much would the TDC labor cost alone be? You may re-prioritize the main breaker switch or air compressor PM.
Looking for the overlooked
Details of the individual metrics within each of the main downtime cost categories would be out of the scope of this article. Please find the list below to have some helpful information and tips. The object is to stimulate creative thinking and help you keep from overlooking an area of potential improvement. There is a great deal of uncertainty and scientific difference of opinion surrounding the metrics of manufacturing cost analyses. This list is just a starting point for improving manufacturing cost analysis.
- Equipment Cost Category (constants)
- Categories: Standardize your data collection categories and learn from MIMOSA.
- People: Indirect labor costs can often be greater than the more apparent direct labor costs.
- Product: Made up of two sub-categories. Cost per Unit and Units per Hour.
- Start-up: Every time you start up your machine, there is a hidden cost.
- Bottleneck: Using a process flow diagram, pre-determine a bottleneck factor for each asset.
- Sales Expectation: Our goal is always to maintain a 100% capacity readiness.
- Labor Cost Category (constants)
- LPP/M: Do your LPP/LPU calculations include indirect labor?
- QC: Associate QC cost, re-work, etc., with actual downtime events.
- Maintenance: A substantial staff supports those one or two who do the machine repair.
- Engineering: Engineering costs to support troubleshooting and repair of machines can slip through the cracks.
- Management: Requesting maintenance, redirecting operators, reporting to upper-level management, altering production schedules/flow, administrative tasks, etc.
- Downtime Cost Category (Occurrence)
- Time: Are you tracking when maintenance arrives at the scene or when the machine first went down?
- Reduced Production: Time and percentage of full-capacity equipment is running at a reduced rate due to a malfunction.
- Scrap: On continuous flow systems, scrap related directly to downtime can be a significant cost.
- Band-Aid: Please note that band-aid time estimates and the number of times needed to be re-applied are usually under-estimated.
- OEM, Consulting, Contractor: Your interactions with OEMs can be a significant cost factor in downtime and other areas.
- Tooling: Often classified as a nuisance problem, it can add up in cost if allowed to continue.
- Parts/Shipping: Out of the parts and procurement fields, the cost of the actual parts is the only value commonly tracked. What about shipping, locating, and rentals?
Reporting true results
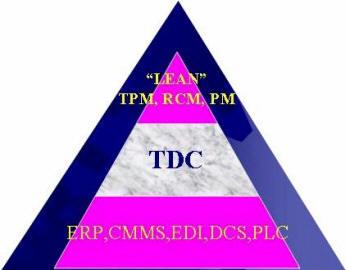
In the past, the philosophy was that the fewer cost buckets I had to manage, the easier my job was. However, today is the day of powerful computer tools and data collection technology. We can now have a computer manage all those buckets and do it however we want. This technology, coupled with people-type methodologies like TQM, TPM, RCM, and Lean Manufacturing, enables us to spare our employees the hardships of downsizing and seek more excellent opportunities such as equipment utilization.
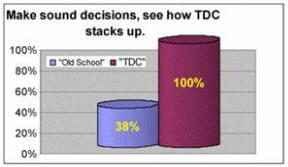
When the world's top consultants are asked, "Why don't manufacturers realize the full potential of programs like TPM, RCM, or even their CMMS software?" you have undoubtedly heard some of the following standard replies. "The program was not endorsed from the top down, and there was a lack of understanding of the strategy or lack of measurable or quantifiable results." The last reply is the most accurate. Realizing the true cost of downtime will best quantify the results.
Hey, there is much wisdom to that saying, "Money talks, ...". If what appears to be a $30K opportunity is found to be a $300K opportunity, endorsement from the top down and commitment to understanding will more likely follow. Just as the leaders who sell a program to the facility must be able to prove the true value, the mechanism must be in place to report the true results. TDC bridges the gap between data collection, software/hardware, and an improvement program such as Lean manufacturing. I have outlined below some clear, concise steps that will lead you to world-class status.
- Use a process flow chart and identify your bottlenecks
- Adopt information standards in your existing and future systems
- Predetermine the "True" cost of downtime for each profit center category
- Use OEE to benchmark and identify areas of opportunity. These guidelines are self-sustaining.
These guidelines are self-sustaining. Most have identified their bottlenecks. Ensure one is noticed hanging on a wall, in a backroom, or outside the building. I have discussed identifying the True Cost to set the appropriate priorities. Next, I will comment on adopting standards and using OEE.
Standards
 Combining the two methods bridges the gap between data collection and management techniques—strict usage of TDC metrics and data sharing standards like MIMOSA. Implementing programs like TPM requires the proper structure, measures, information, and commitment. Only using vague, generalized tools like OEE to base day-to-day financial decisions can cost thousands to millions. Build your facility on rock; build it on standards. Combining the two methods bridges the gap between data collection and management techniques—strict usage of TDC metrics and data sharing standards like MIMOSA. Implementing programs like TPM requires the proper structure, measures, information, and commitment. Only using vague, generalized tools like OEE to base day-to-day financial decisions can cost thousands to millions. Build your facility on rock; build it on standards. |
MIMOSA is more than an organization developing open exchange conventions. It enables integrated maintenance management, a connection to enterprise resource programs, and practical profitability-related operations and maintenance. Require your software vendors and program administrators to use TDC guidelines and MIMOSA standards. Doing so will reduce implementation costs, enhance benchmarking tools, and ensure success.
Overall Equipment Effectiveness
The overall performance of a single piece of equipment, or even an entire factory, will always be governed by the cumulative impact of the three OEE factors: Availability, Performance Rate, and Quality Reject Rate. To my amazement, when I was a speaker at an AFE convention in Las Vegas, the group did not know what OEE was. I was in a popular online chat session shortly afterward where the guest speaker was Robert Hansen, the author of the book "Overall Equipment Effectiveness: A Powerful Production/Maintenance Tool for Increased Profits".
What was the question being asked of him? "What is OEE?"
Overall Equipment Effectiveness
Availability X Performance X Quality= OEE
Availability - Percent of scheduled production (to measure reliability) or calendar hours 24/7/365 (to measure equipment utilization) or equipment or line status (to measure the ability to produce) that equipment or a production line is available for production.
Note: Measures the percent of the time the equipment is operational (usually total hours of 24-7-365), divided by the equipment uptime (actual production).
Performance Rate - Percent of parts produced per time frame, of maximum rate OEM rated production speed. If OEM specification is unavailable, use the best-known production rate, or the company can establish a standard production rate.
Note: Performance efficiency is the percentage of time the equipment produces products at its theoretical speed for individual products. It measures speed losses. (i.e., inefficient batching, machine jams)
Quality Rate - Quality as a percent of good sellable parts out of total parts produced per time frame.
Note: Determining the percent of the total output that is good. (i.e., all products, including production, engineering, rework, and scrap.)
Terrence O'Hanlon, the host of that chat session, had an excellent quote that gets to the heart of what I have seen, "They do not know what they do not know". With the knowledge and utilization of the OEE calculation, realizing a 40% increase or greater is not uncommon. If you're making a profit now, consider new opportunities to increase the existing. More importantly, OEE is the glue that sustains other initiatives by enabling all to know where to focus and see the results of their efforts. The exciting point is that OEE is a simple method of measuring, and you can start utilizing it today!
The world's leaders in the industry are mostly in agreement on how to implement OEE and why. I attribute this fact to its simplicity. Identify your bottlenecks and major cost centers to benchmark and monitor first. I recommend using the calendar time metric (24/7/365) for your availability factor. Machine utilization will also indicate reliability performance, giving you the whole picture and immediately focusing your resources on the most significant opportunity. Also, using OEE as a benchmarking tool would not work well if based on varying production schedules to calculate it. Benchmarks must be based on a constant to allow portability to similar industries and markets. The bottom line is that implementing OEE is irrelevant if you don't start utilizing it at all. What they say, "Doing something is better than doing nothing at all," is very true.
My challenge to the industry is stopping OEE Ignorance and spreading the word about this valuable tool. Joel Lenard's favorite topic is "What is the Cost of Ignorance?". I propose that in using True Downtime Cost™, we will start to see. Below are the best resources I have seen to follow up on this article.
Standards - https://www.mimosa.org/mimosa-osa-cbm
OEE - https://bin95.com/articles/maintenance-management/overall-equipment-effectiveness-oee.htm
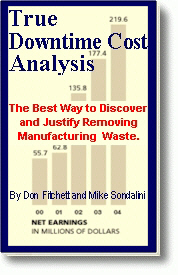
True Downtime Cost Analysis - 2nd Edition
eBook By Don Fitchett and Mike Sondalini
"Costing methods & techniques for manufacturing processes to offer the greatest return on capital employed (ROCE)."
Description:
True Downtime Costs™ Analysis focuses on costing methods and costing techniques that quantify activities. Even those that previously fell under the indirect cost definition, like the hidden cost of outsourcing, warranties, etc. This technique is necessary for bottleneck management and applies to piece manufacturing and other industries.
Authors Don Fitchett and Mike Sondalini coauthored the extension of the original eBook "The True Cost of Manufacturing Downtime" (ISBN 1-933047-15-1). This second edition also provides an action plan to utilize existing shop floor data collection to monitor all the manufacturing processes and associated costs.
"True Downtime Cost" (TDC) ® is a registered trademark of Business Industrial Network (https://BIN95.com)
![]() Right click - "Save As", to download a PDF copy of this article. (Note: This is not the entire book above; this is just the article on this page.) Then, you can print and give it to your associates or link it to your website!
Right click - "Save As", to download a PDF copy of this article. (Note: This is not the entire book above; this is just the article on this page.) Then, you can print and give it to your associates or link it to your website!